Blood Sugar Calculator
References:
Rohlfing CL et al.Defining the Relationship Between Plasma Glucose and HbA1c, Analysis of glucose profiles and HbA1c in the
Diabetes Control and Complications Trial," Diabetes Care 25:275-278, 2002.PUBMED
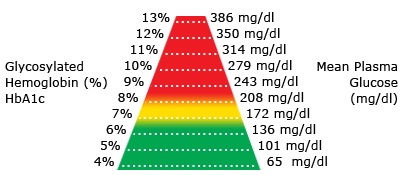
A1c and Average Blood Sugar
Know the relationship between your HbA1c as it relates to your average blood sugars

Assay values based upon the DCCT study, 1984-1993.
A1c color pyramid from: Americian Diabetes Association Clinical Practice Recommendations 2009.
The Diabetes Control and Complications Trial (DCCT) revealed a linear relationship
between the HbA1c (glycosylated hemoglobin) values between 8% and 5% to the
risk of eye disease. The study proved that for every 10% decrease in the A1c
the risk of developing diabetic retinopathy decreases by 43%.
|
Lowering A1c 10% |
Decreased Risk of |
|
| From 8.0% to 7.2% | 43% | |
| From 7.2% to 6.5% | 43% | |
| From 6.5% to 5.8% | 43% | |
| From 5.8% to 5.2% | 43% |
